# Give Your Coding Agent Eyes: Cloudflare Skills, Observability MCP, and Local-First TDD
Table of Contents
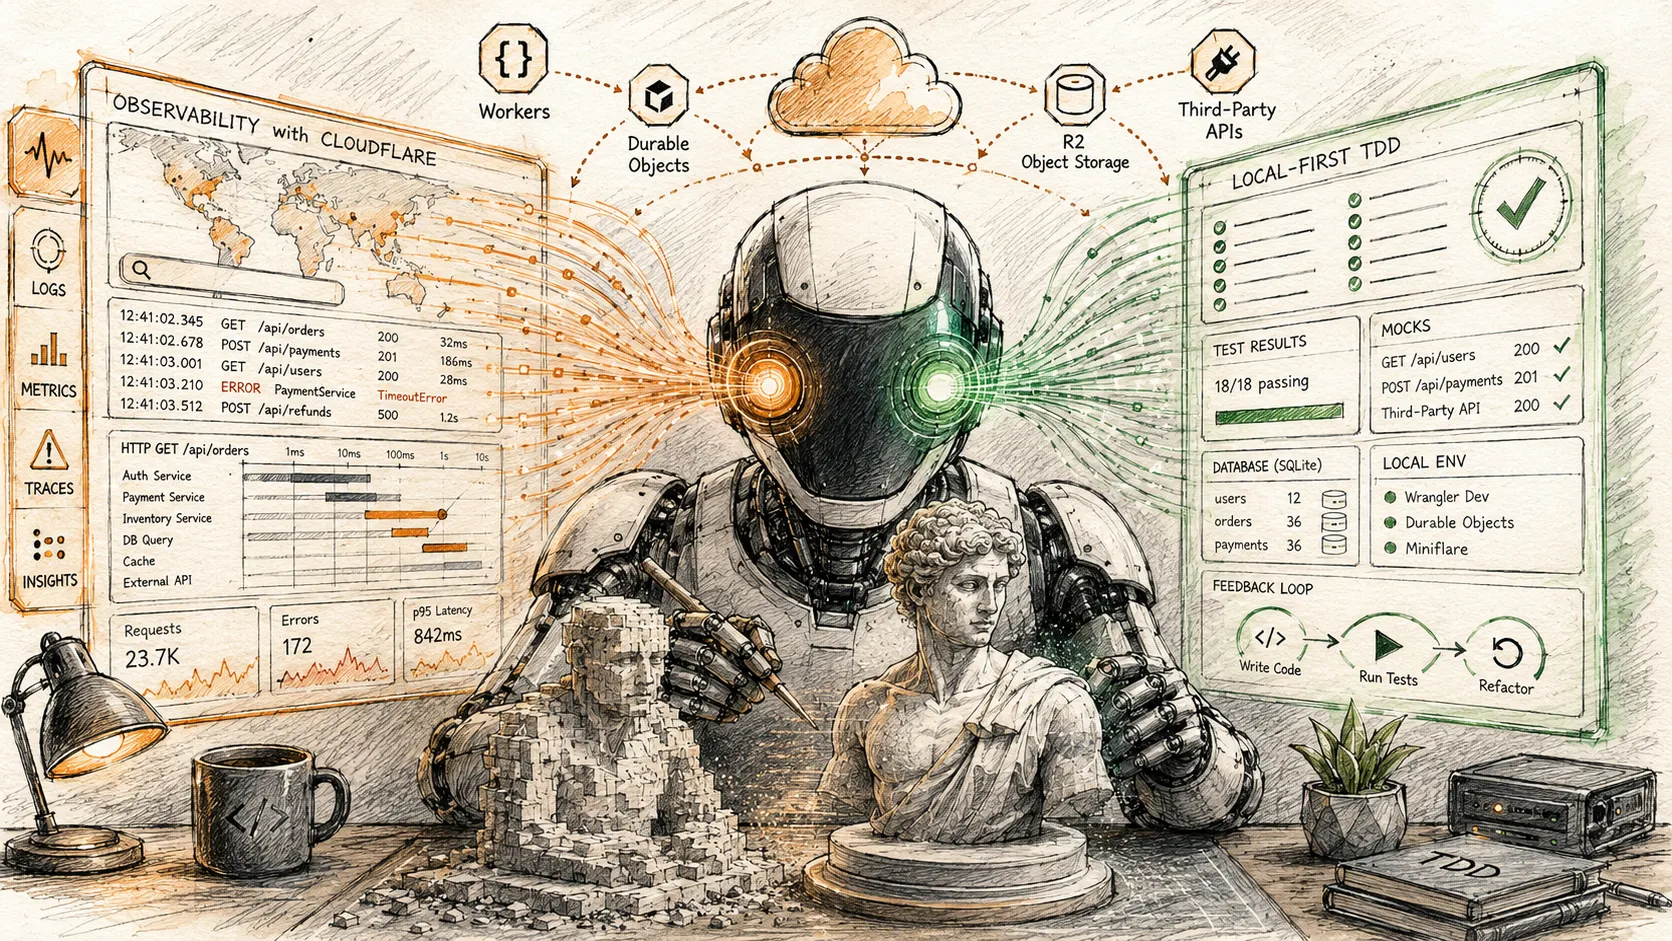
Coding agents are tireless and fast — and blind by default. This post is about the two feedback loops I wired into my Cloudflare Workers project so that Claude Code can see what my code does: production logs it can query itself, and a local test suite that simulates the entire platform — Durable Objects, SQLite, R2, third-party APIs — in seconds. It’s the closest thing to a silver bullet I’ve found for agentic coding.
The blind sculptor
I recently watched a video by Salvatore Sanfilippo (antirez) — “Il trucco decisivo (davvero) per lavorare coi coding agent” — that puts into words something I had been circling around for months. Full credit to him for the framing; if you understand Italian, go watch it.
His argument goes like this. You’ve heard all the standard advice about coding agents: write precise specs, share your design intuitions in non-binding language, keep the codebase clean, comment the tensions in the code and not just the mechanics. All true, all useful. But there’s one property of LLM agents that almost nobody talks about, and it’s the one that changes everything: tenacity. An agent will try, and retry, and retry again, at a speed no human can match. Each failed attempt costs it seconds, not an afternoon of motivation.
Then comes his metaphor, which I can’t stop thinking about. Imagine a tireless worker in front of a block of marble. He can even travel back in time: chip the marble wrong, rewind, try again, forever. His tools are crude — he can’t carve like Michelangelo, he can only throw stones — but he never stops and never gets tired. Given enough attempts, he’ll get somewhere remarkable.
Unless he’s blind.
If the worker can’t see the marble, no amount of tenacity or time travel helps. His attempts aren’t informed by the results of the previous ones. He’s just throwing stones into the dark.
That’s your coding agent without feedback loops. And that’s why I’ve stopped optimizing my prompts and started optimizing my agent’s senses.
Two kinds of sight
A coding agent needs to see two different things:
- What the code actually did — production behavior: errors, logs, timelines, the request that failed at 11:51 and everything that happened around it.
- What the code will do — the consequences of the change it just made, before it ships: does the flow still work, did the database end up in the right state, did we call the third-party API the way we think we did.
On Cloudflare, both of these are now things the agent can operate by itself, without me clicking through dashboards or babysitting a staging environment. The first comes from Cloudflare’s skills and MCP servers; the second from @cloudflare/vitest-pool-workers and a deliberately local-first test architecture.
Let me show you both, with real (lightly anonymized) material from my project: a multi-tenant platform on Workers that integrates with crypto exchanges — Hono API, Durable Objects with SQLite, R2, D1, drizzle-orm, the works.
Part 1: Let the agent read production
Setup
Cloudflare ships official skills for Claude Code — contextual guidance modules for Workers, Durable Objects, wrangler, the Agents SDK and more. They follow a retrieval-first philosophy: instead of trusting what the model memorized about the platform in 2024, the skill tells it to go look things up.
Then there’s the part that gave my agent actual eyes on production: the Workers Observability MCP server. One command:
claude mcp add cloudflare-observability --transport http https://observability.mcp.cloudflare.com/mcpAuthenticate via /mcp (it runs its own OAuth flow against your Cloudflare account), and your agent can now query every log line your Workers emitted in the last seven days: filters, full-text needles, group-bys, percentile calculations. Not wrangler tail and hope the bug happens again — historical production telemetry, queryable in structured form.
The war story
Here’s what sold me. Our OAuth flow for connecting a user’s exchange account started failing in production with:
OAuth completion failed: <Exchange> API error: Temporary lockoutHTTP 400, connection reported as failed. Except… the API key was created on the exchange, with the correct scopes. The user could see it in their account. Something was claiming failure on a success.
Old me would have spent the evening in the dashboard: filter by URL, squint at timestamps, open fifteen log entries, correlate by hand. Instead I pasted one sample log line into Claude Code and asked it to investigate.
What it did, autonomously, was the interesting part:
First, it read the code before touching the logs. It traced the exact throw site: our callback created the API key, then immediately called the exchange’s private balance endpoint as a “verification” step — and treated any error as fatal. The wallet was never persisted. The key existed on the exchange; we just threw it away and told the user it failed.
Then it went to the logs to test the hypothesis. My sample log had an ULID for an ID. The agent decoded the timestamp out of it (ULIDs embed milliseconds — I honestly didn’t know), got the exact failure moment, and queried a window around it:
{ "view": "events", "timeframe": { "from": "…T10:30:00Z", "to": "…T12:10:00Z" }, "parameters": { "filters": [ { "key": "$metadata.service", "operation": "eq", "value": "workers-prod" }, { "key": "$metadata.level", "operation": "eq", "value": "error" } ], "needle": { "value": "lockout" } }}Then it zoomed out and grouped. Instead of staring at single events, it ran a count grouped by $metadata.trigger across the whole week. The result was the smoking gun: the “Temporary lockout” error wasn’t an OAuth problem at all. It showed up in four unrelated subsystems — the balance-refresh endpoint, a deposit-address endpoint, a cron job, a Durable Object alarm doing withdrawal polling. It was account-level throttling state on the exchange’s side, pre-existing before the OAuth callback even ran. A brand-new, perfectly valid API key walked into a locked room.
The reconstructed timeline read like a detective’s whiteboard:
11:39 burst of "Invalid key" errors (a stored wallet with a dead key, hammered by balance refresh)11:45 cron job hits "Temporary lockout" ← account already locked, before any OAuth11:51 OAuth connect: key created OK → balance verification → "Temporary lockout" → 40011:56 user retries → 500 "Missing idempotency key" ← a *second*, unrelated bug11:57 user retries → 50011:57 user retries → 500Along the way it found two bonus bugs I hadn’t asked about: the retry path 500’d because a cookie was missing and the error handler didn’t cover it (so the widget never even got a failure message), and a * * * * * cron was flooding the logs with hundreds of harmless warnings per minute — which matters more than it used to, because log noise now degrades the agent’s queries too, not just mine.
The final root cause turned out to be even better: the exchange applies a ~15-minute security cooldown on private API calls whenever an account connects from a new device or IP — which is literally what an OAuth connect is. Our synchronous verify-right-after-create design was structurally guaranteed to fail on first connects. The fix wasn’t retry logic; it was persisting the key immediately and deferring the balance check past the cooldown.
I never opened the Cloudflare dashboard. The agent formed hypotheses from the code, tested them against production telemetry, and revised. That’s antirez’s tireless sculptor — with eyes.
Gotchas from the trenches
Three things that will bite you, so they don’t have to:
MCP servers added mid-session need a reconnect. claude mcp add updates the config, but a running Claude Code session won’t see the new server’s tools until you run /mcp in that session (or restart it). I lost ten confused minutes to this.
Log hygiene is now agent performance. A needle search across a noisy service returns the noise. My first “show me everything around the failure” query came back 100% cron warnings. If you want agents to debug from your logs, treat log spam as a bug with a real cost.
Part 2: Local-first TDD is the agent’s other eye
Production sight tells you what went wrong. The second loop — the one that makes the agent productive rather than just diagnostic — is a test suite it can run itself, that answers truthfully, in seconds.
The unlock on Cloudflare is @cloudflare/vitest-pool-workers: your tests don’t run in Node with mocked platform APIs — they run inside workerd, the actual Workers runtime, booted by Miniflare from your real wrangler.jsonc. Durable Objects, their SQLite storage, R2, D1, KV, rate limiters: all real implementations, all local, all in-process.
export default defineWorkersConfig({ test: { sequence: { concurrent: false }, poolOptions: { workers: { isolatedStorage: false, wrangler: { configPath: './wrangler.jsonc' }, // ← the whole platform, in-process moduleRules: [{ type: 'Text', include: ['**/*.sql'] }], }, }, },})Here’s what that enables in practice in my codebase.
The database in your tests is the production database
Every tenant in my system is a Durable Object whose ctx.storage SQLite is managed by drizzle-orm. Migrations run in the DO constructor:
import { drizzle } from 'drizzle-orm/durable-sqlite';import { migrate } from 'drizzle-orm/durable-sqlite/migrator';import migrations from '../generated-migrations';
constructor(ctx: DurableObjectState, env: Env) {  this.db = drizzle(ctx.storage, { schema: tenantSchema });  ctx.blockConcurrencyWhile(() => migrate(this.db, migrations));}
Because vitest boots the same DO class under Miniflare, the local test database has exactly the production schema — same migrations, same engine, no “SQLite-flavored mock of our Postgres”. (One wrinkle: the Workers sandbox can’t read files off disk, so a small build step code-gens the .sql migration files into a JS string module before the suite runs. Ugly, effective.)
White-box assertions with runInDurableObject
cloudflare:test exposes a magic escape hatch: reach inside a Durable Object instance and run assertions against its private state.
const identities = await runInDurableObject(orgDb, async (instance: TenantDurableObject) => { const db = (instance as any).db; return db.select().from(cexIdentities).all();});expect(identities).toHaveLength(0);This is the difference between “the endpoint returned 200” and “the row actually landed, with the secret encrypted at rest”. My suite uses it in 46 test files.
Third-party APIs become hard assertions
The scariest part of an exchange integration is the outbound calls — the part agents most love to hallucinate. fetchMock from cloudflare:test turns that into a contract:
beforeEach(() => {  fetchMock.activate();  fetchMock.disableNetConnect();   // any unmocked outbound call = test failure});
fetchMock.get('https://api.exchange.example')  .intercept({ method: 'POST', path: '/oauth/token' })  .reply(200, oauthTokenSuccessFixture);
// …run the flow…
fetchMock.assertNoPendingInterceptors();  // every expected call actually happened
disableNetConnect() means the agent cannot accidentally test against the real internet, and a hallucinated extra API call fails loudly instead of silently working-ish. assertNoPendingInterceptors() means a missing call fails too. The mock isn’t a stub; it’s a spec.
The golden loop
Put together, one test exercises the entire vertical: mock the exchange’s three endpoints → invoke the real Hono route → assert the HTTP response, the mock contract, and the Durable Object’s SQLite state:
it('completes OAuth → API key → balance → wallet storage', async () => {  fetchMock.get(EXCHANGE).intercept({ path: '/oauth/token', method: 'POST' }).reply(200, tokenFixture);  fetchMock.get(EXCHANGE).intercept({ path: '/oauth/api-key', method: 'POST' }).reply(200, keyFixture);  fetchMock.get(EXCHANGE).intercept({ path: '/private/Balance', method: 'POST' }).reply(200, balanceFixture);
  const response = await app.request(callbackUrl, { headers }, env);
  expect(response.status).toBe(200);  fetchMock.assertNoPendingInterceptors();
  const wallet = await runInDurableObject(orgDb, (i: TenantDurableObject) => i.getWallet('wallet-123'));  expect(wallet).toMatchObject({ exchange: 'exchange', type: 'long-living' });  expect(wallet!.apiSecret).not.toBe(keyFixture.result.secret); // encrypted at rest});
Why does this matter specifically for agents? Go back to the sculptor:
- Speed feeds tenacity.
npx vitest run test/oauth2/callback.test.tsgives the agent a red/green verdict on the full stack in seconds. Each stone thrown is instantly evaluated. Fifty iterations cost minutes, not days. - Determinism keeps the feedback truthful. No flaky staging, no shared environment drift, no “worked on my machine”. Miniflare state is wiped at the start of each run.
- Strictness catches hallucinations. The combination of
disableNetConnect+assertNoPendingInterceptorsis an anti-hallucination device: the agent can’t invent an API interaction that “probably exists” — the contract is executable. - It’s self-serve. The agent doesn’t ask me to click through a UI to verify. It writes the failing test, makes it pass, and shows me the output. TDD was always a feedback-loop discipline; agents are simply the first developers tenacious enough to exploit it fully.
(Honesty aside: being this local-first on a young platform has costs. I’m currently shipping on patched community forks of drizzle-orm and better-auth to make the adapters behave. Early-adopter tax.)
The honest 100x
“100x” is a big claim, so let me locate it precisely. It’s not typing speed. It’s the product of iteration count × truthfulness of feedback, and it looks like this:
| Task | Me, manually | Agent with eyes |
|---|---|---|
| ”Why did this 400 happen in prod?“ | 30–60 min of dashboard spelunking, if I’m lucky | One prompt; agent correlates code + a week of logs, returns a timeline and two bonus bugs |
| ”Did I just break the withdrawal flow?” | Deploy to staging, click through the widget | vitest run — full stack verdict in seconds, DO state included |
| ”Do we call the exchange API correctly?” | Read their docs again, hope | assertNoPendingInterceptors() — the contract is a test |
| ”Is this platform API still shaped like I remember?” | Tab-switch to docs | Cloudflare skill retrieves current docs instead of trusting training data |
The agent was always tenacious. It was always fast. Those were never the bottleneck — sight was. Wire up production telemetry it can query and a local world it can simulate, and the tireless worker in front of the marble finally watches where each stone lands.
Now it sculpts.
Credits & links
- Salvatore Sanfilippo (antirez), Il trucco decisivo (davvero) per lavorare coi coding agent — the blind-sculptor framing that inspired this post. Grazie.
- cloudflare/skills — official Agent Skills for Claude Code and other agents.
- Cloudflare agent setup guide for Claude Code — skills + MCP servers, including the Observability MCP server.
- Vitest integration for Workers —
@cloudflare/vitest-pool-workers,runInDurableObject,fetchMock.